NT2004B Application of nanodevices in integral solutions, 2026
Non-enzymatic electrochemical glucose sensor with Cu₂O nanoparticles
AUTHORS
André Daniel Andrade Gaxiola, Manuel Alejandro Ríos de Nicolás, Marco Andrés Ávila Discua, Gerardo García Soria and Ari Emilio Núñez Menéndez
PROFESSORS
Diego A. Crespo Yapur, Adad Yepiz Escalante, María del Rosario Herrera Rivera
DATE
May 3, 2026
Summary
A glucometer with no enzyme, made from copper and carbon paste.
Diabetes mellitus affects more than 537 million people and demands accessible, stable and low-cost monitoring devices. Faced with the limitations of commercial enzymatic glucometers, this work explores an alternative based on the Cu(I)/Cu(II)/Cu(III) transition in an alkaline medium.
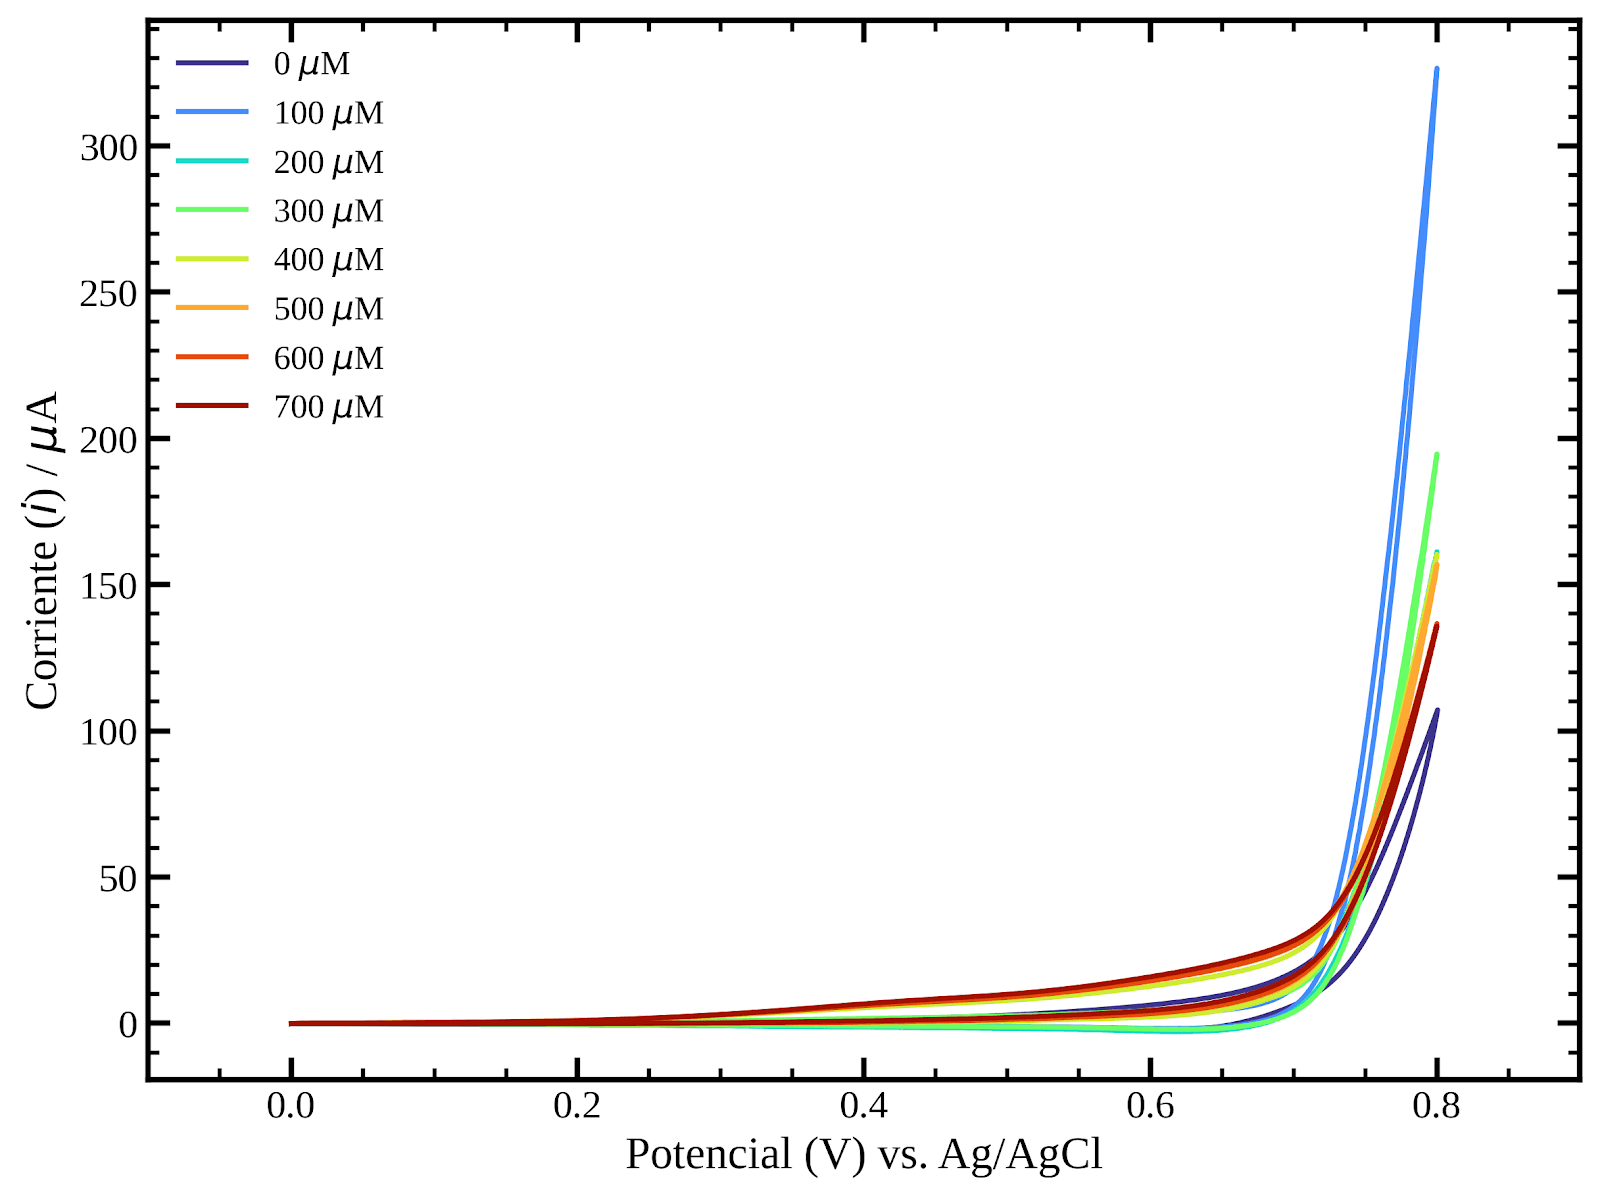
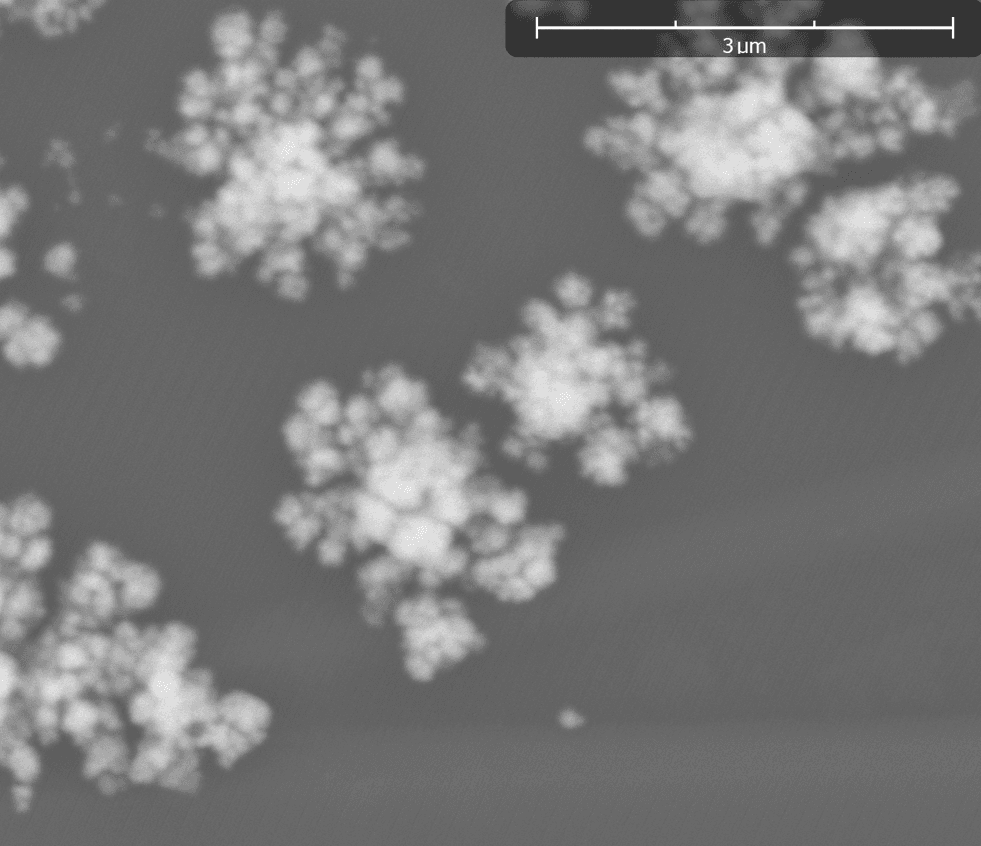
We designed, fabricated and characterized a non-enzymatic glucose sensor with cuprous oxide (Cu₂O) nanoparticles deposited by pulsed potentiostatic electrodeposition on carbon paste electrodes, using pulses of −0.4 V and 0 V over 15 cycles. Characterization was done by cyclic voltammetry in 0.1 M NaOH, with an EmStat3+ Blue potentiostat and data processing in Python.
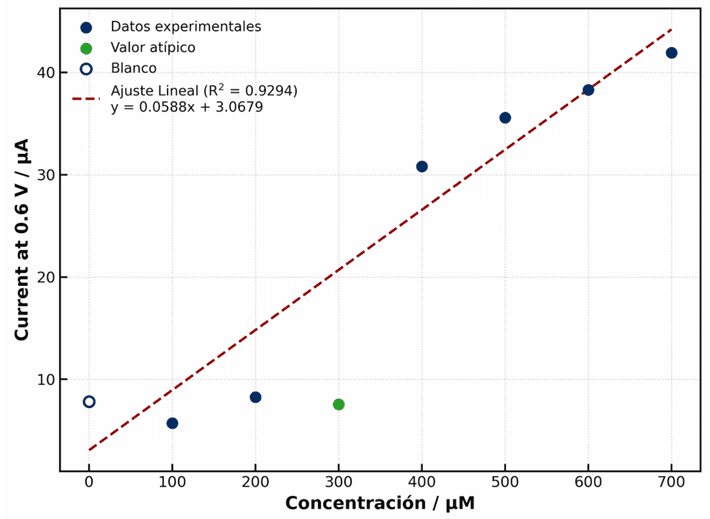
The modified electrode showed measurable electrocatalytic activity between 0.4 and 0.7 V, with a current increase proportional to glucose concentration in the 100 to 700 µM range. The report also discusses integration with embedded electronics, the advantages over enzymatic sensors and ISFETs, and the regulatory framework (COFEPRIS, NOM-241-SSA1, FDA, ISO 13485).
What I did
What I did
Pulsed electrodeposition of Cu₂O on carbon paste electrodes, cyclic voltammetry and data processing in Python. Integration with embedded electronics and the regulatory framework (COFEPRIS, FDA, ISO 13485).
Key results
Key results
0.0588
µA·µM⁻¹ estimated sensitivity
34.0 µM
limit of detection (LOD)
100–700
µM linear glucose range
0.9294
R² of the calibration curve
Source: Final report NT2004B, Team 3, May 2026
Figures
Figures
SOURCE: FINAL REPORT NT2004B, 2026
SOURCE: FINAL REPORT NT2004B, 2026
SOURCE: FINAL REPORT NT2004B, 2026
Tools
Tools
ReporteFinal_NT2004B_Cu2O_CPE_E3.pdf